Product × market / research brief
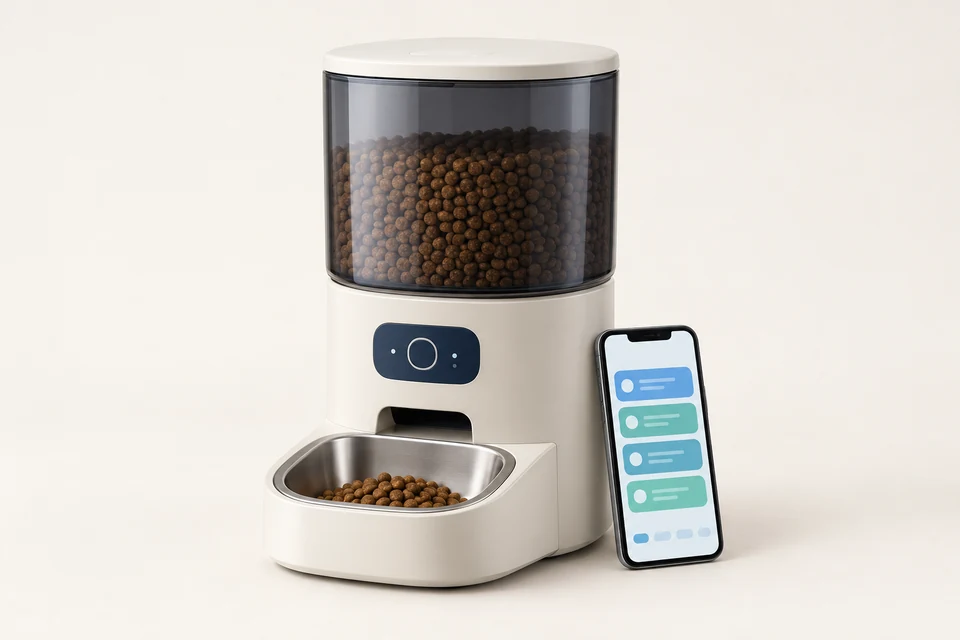
Smart pet feeders (Wi-Fi/app-controlled) — United States
Entry verdict
TEST
Large, growing U.S.
Market opportunity
Score out of 10
Entry feasibility
Score out of 10
C
Evidence grade
Confidence limits the decision
Opportunity describes demand; feasibility describes entry conditions. Neither is a guarantee. Saved outlook: Solid Market.
01Customers & product fit
Customers & product fit
Possible customer organisations, needs and buying expectations.
Buyer expectations
| Expectation | Importance | Note |
|---|---|---|
| Expectation Reliable Wi-Fi connectivity and app performance | Importance Must-have | Note Connectivity issues are a top reason for returns; 30% of first-time buyers cite app glitches. |
| Expectation Portion control accuracy | Importance Must-have | Note Most feeders have 5-10% dispensing variance; consumers expect precision. |
| Expectation Easy setup and onboarding | Importance Must-have | Note Setup difficulty drives returns; clear instructions and in-app guidance are essential. |
| Expectation Camera and remote monitoring | Importance Nice to have | Note Becoming standard; 68% of smart feeders in 2026 have cameras. |
Possible customer organisations — not confirmed interested buyers
| Company | Type | Why Fit | Role To Target | Priority | Website |
|---|---|---|---|---|---|
| Company PetSafe | Type Brand/manufacturer | Why Fit Major player in smart pet feeders; may source OEM or compete. | Role To Target Procurement or product development | Priority B | Website |
| Company Petlibro | Type Brand/online retailer | Why Fit Sells smart feeders on Amazon and own site; potential competitor or partner. | Role To Target Sourcing manager | Priority B | Website |
| Company WOPET | Type Brand/online retailer | Why Fit Known for app-controlled feeders; may seek differentiated products. | Role To Target Product manager | Priority B | Website |
| Company PETKIT | Type Brand | Why Fit Global smart pet brand; potential OEM buyer or competitor. | Role To Target Supply chain | Priority C | Website |
| Company Chewy | Type Online retailer | Why Fit Major U.S. pet e-commerce; sells third-party brands. | Role To Target Category buyer | Priority A | Website |
| Company Petco | Type Retail chain | Why Fit Large pet specialty retailer with online and physical stores. | Role To Target Merchandising | Priority A | Website |
| Company Amazon (via FBA) | Type Marketplace | Why Fit Largest online channel for smart feeders. | Role To Target N/A (direct listing) | Priority A | Website |
Product and market fit
| Segment | Need | Fit | Price Sensitivity | Sales Difficulty |
|---|---|---|---|---|
| Segment Tech-savvy cat owners in urban areas | Need Remote feeding and portion control for busy schedules | Fit Excellent | Price Sensitivity Medium | Sales Difficulty Medium |
| Segment Dog owners with large breeds | Need Larger capacity and durable feeders | Fit Strong | Price Sensitivity Medium | Sales Difficulty Medium |
| Segment Budget-conscious first-time buyers | Need Affordable basic smart feeder | Fit Moderate | Price Sensitivity High | Sales Difficulty High |
| Segment Premium buyers wanting cameras and AI | Need Advanced features and integration | Fit Strong | Price Sensitivity Low | Sales Difficulty Medium |
| Segment Multi-pet households | Need Multi-pet feeding logic or multiple feeders | Fit Moderate | Price Sensitivity Medium | Sales Difficulty High |
Customer research notice
Possible organisations to investigate, not confirmed buyers, leads with purchase intent, or customers of this supplier.
02The decision
The decision
Verdict, key takeaways and who this opportunity suits.
Decision summary
The U.S. smart pet feeder market was valued at USD 601.38 million in 2024 and is projected to reach USD 940.94 million by 2030, growing at an 8.08% CAGR. Wi-Fi-enabled models dominate, driven by pet humanization, busy lifestyles, and demand for portion control and remote monitoring. The category faces high return rates (12-20% of gross profit for lower-priced models) due to setup and connectivity issues, making quality and support critical. Tariff classification under HTS 8509.80.5095 carries a 4.2% duty, but additional China tariffs may apply. Success requires robust app functionality, reliable connectivity, and effective customer support to reduce returns.
Entry decision
Illustrative assumptions only. Obtain written quotes and verify duties, costs and demand before investing.
- Verdict
- TEST
- Verdict Reason
Large, growing U.S. market with clear tariff classification, but certification claims are unverified and returns/support costs are high; a small test order is warranted before scaling.
- Best Customer
U.S. online pet-tech retailers and Amazon sellers targeting tech-savvy cat and small-dog owners
- Best Product
Wi-Fi/app-controlled automatic feeder, 3–5L capacity, with backup battery and portion control (camera optional)
- Best Channel
Direct-to-consumer via Amazon FBA plus a brand-owned Shopify store
- Target Retail Price
USD 120–180
- Target Landed Cost
USD 45–60
- Expected Gross Margin
50–60% before returns/support
- Entry Budget
USD 25,000–40,000
- Time To Market
4–6 months
- Biggest Obstacle
Unverified product certifications (FCC, UL/ETL) and high return/support burden
- Confidence
Medium
Key takeaways
U.S. smart pet feeder market is USD 601M in 2024, growing at 8% CAGR to USD 941M by 2030.
Wi-Fi-enabled models dominate; camera integration and voice control are key trends.
High return rates (12-20% of gross profit) due to connectivity and setup issues require robust support.
Tariff classification under HTS 8509.80.5095 carries 4.2% duty; additional China tariffs may apply.
Success hinges on reliable app performance, quality, and customer support to reduce returns.
Who this may not suit
| Profile | Why |
|---|---|
| Profile Importers with no U.S. product certification experience | Why FCC and UL/ETL compliance is complex and costly; failure can lead to customs seizure or retailer rejection. |
| Profile Businesses unable to handle 10–20% return rates | Why Electronics and app-based products have high return rates due to setup issues and pet rejection. |
| Profile Those seeking a low-cost, low-risk entry | Why Minimum viable entry requires ~USD 25k–40k for certification and inventory. |
| Profile Brands without app development or customer support capability | Why Ongoing app maintenance and technical support are essential for smart feeders. |
Product category
Smart pet feeders (Wi-Fi/app-controlled)
03Market & competition
Market & competition
Demand signals, market size, competitors and entry scores.
Opportunity outlook
Steady 8% growth and a large U.S. installed base make this an attractive market, but high return rates and price sensitivity demand careful product and support investment. Differentiation through reliability, app quality, and features like cameras can yield strong margins.
Entry feasibility scorecard
Entry factors at a glance
Saved scores out of 10. Factor labels follow the research; these are not probabilities. Colors distinguish factors.
- Factors
Market demand
- Score
- 8
- Why
U.S. smart pet feeder market ~USD 601M in 2024, growing 8% CAGR; Wi-Fi segment dominant.
Growth
- Score
- 7
- Why
Projected 8–11% CAGR to 2030; pet humanization and busy lifestyles drive adoption.
Competition
- Score
- 4
- Why
Crowded with established brands (PetSafe, Petlibro, WOPET, PETKIT) and low-cost imports.
Regulatory difficulty
- Score
- 5
- Why
FCC required for Wi-Fi; UL/ETL not mandatory but often demanded by retailers; no specific pet-feeder regulation found.
Margin potential
- Score
- 6
- Why
Gross margins 50–60% possible, but returns/support can consume 12–20% of gross profit.
Import complexity
- Score
- 7
- Why
Clear HTS classification (8509.80.5095, 4.2% duty); standard ocean freight from China.
Local partner availability
- Score
- 5
- Why
Many U.S. distributors and Amazon sellers, but no named importers in evidence; requires outreach.
Speed to market
- Score
- 6
- Why
4–6 months including sourcing, certification, and first shipment.
Evidence confidence
- Score
- 4
- Why
Market size data from multiple research firms but conflicting; no official U.S. import statistics or certification cost data.
- Overall
6
- Note
Attractive market but competitive and operationally demanding; certification and returns are key risks.
Market size and confidence
- Current Value
USD 601.38 million
- Year
2024
- Growth Rate
8.08% CAGR
- Forecast Value
USD 940.94 million
- Forecast Year
2030
- Confidence
HIGH
- Basis
U.S. smart pet feeder market value from Grand View Research and Research and Markets, consistent across sources.
Demand drivers
| Driver | Impact | Detail |
|---|---|---|
| Driver Pet humanization and premiumization | Impact High | Detail Owners increasingly spend on premium companion care products, including smart feeders that promote health and well-being. |
| Driver Busy lifestyles and travel | Impact High | Detail Long work hours and travel create need for automated feeding solutions with remote monitoring via apps. |
| Driver Health and nutrition awareness | Impact Medium | Detail Portion control and customized schedules help prevent overfeeding and support balanced diets. |
| Driver Technological advancements | Impact Medium | Detail Wi-Fi connectivity, app control, cameras, and AI features enhance convenience and appeal to tech-savvy consumers. |
Market signals
| Trend | Detail | Signal | Momentum |
|---|---|---|---|
| Trend Camera integration | Detail In 2024, 30% of smart feeders had cameras; by 2026, 68% do, according to PawVortex. | Signal Rapid adoption of camera-equipped models. | Momentum Accelerating |
| Trend Voice assistant compatibility | Detail Over 40% of new models launched in 2023 featured Alexa or Google Assistant compatibility; now about half of smart feeders are Alexa-compatible. | Signal Mainstream integration with smart home ecosystems. | Momentum Accelerating |
| Trend AI-powered feeding algorithms | Detail Feeders with AI can assess dietary needs and create custom schedules, as seen in recent product launches. | Signal Emerging but growing, with 30% of new launches tech-enabled. | Momentum Steady |
| Trend Multi-pet and dual-hopper designs | Detail PETKIT launched YUMSHARE Dual-Hopper 2 with cat facial recognition in December 2025. | Signal Addresses multi-pet households and portion differentiation. | Momentum Steady |
Seasonality
- Peak Months
November
December
- Slow Months
January
February
- Planning Note
Peak demand aligns with holiday gifting; plan inventory and logistics to arrive by October. Chinese New Year may affect supply in Q1.
Customer needs
- Typical Buyer
Tech-savvy pet owners, busy professionals, and frequent travelers concerned about pet feeding schedules.
- Demographics
Urban and suburban households, dual-income families, single-person households, and millennials/Gen Z pet parents.
- Price Sensitivity
Medium
- Price Sensitivity Note
Premium models ($150-$350) appeal to affluent owners, but lower-priced models face high return rates; value-conscious buyers exist.
- Key Values
Convenience
Pet health and well-being
Reliability
Smart home integration
- Shopping Channels
Online e-commerce (Amazon, Chewy, brand websites)
Pet specialty stores
Mass retailers (Walmart, Target)
- Purchase Drivers
Remote feeding control
Portion control
Camera monitoring
App connectivity
Brand reputation
Routes to market
| Channel | Fit | Note | Typical Margin | How To Enter |
|---|---|---|---|---|
| Channel Online e-commerce (Amazon, Chewy, brand sites) | Fit Strong | Note Dominant channel for smart pet feeders; high return rates require robust support. | Typical Margin 30-40% gross margin for brands | How To Enter List on Amazon and Chewy; invest in SEO and reviews; offer easy returns. |
| Channel Pet specialty retail (Petco, PetSmart) | Fit Moderate | Note Provides hands-on demonstration and trust, but shelf space is limited. | Typical Margin 40-50% gross margin | How To Enter Partner with distributors or pitch directly to buyers; offer in-store demos. |
| Channel Mass merchants (Walmart, Target) | Fit Moderate | Note High volume but price pressure; suitable for entry-level models. | Typical Margin 25-35% gross margin | How To Enter Meet volume and packaging requirements; competitive pricing. |
| Channel Direct-to-consumer (brand website) | Fit Strong | Note Higher margins and customer data, but requires marketing investment. | Typical Margin 50-60% gross margin | How To Enter Build Shopify store; leverage social media and influencer marketing. |
Competitors and entry barriers
- Market Leaders
Saved report details Name Position Strength Name PetSafe
Position Established brand with broad product line
Strength Brand recognition, distribution, and reliability.
Name Petlibro
Position Innovative smart feeder brand
Strength Wi-Fi and Bluetooth sync, app control, and camera features.
Name WOPET
Position Value-oriented smart feeder brand
Strength Affordable models with app control and Alexa compatibility.
- Main Competitors
Saved report details Origin Advantage Origin China
Advantage Low-cost manufacturing and fast iteration.
Origin United States
Advantage Brand trust and local customer support.
Origin Europe
Advantage Design and premium features.
- Your Edge
Focus on reliability, app quality, and customer support to reduce returns and build loyalty.
- Gaps
Reliable connectivity and app performance
Better onboarding and setup experience
Affordable models with essential smart features
- Barriers To Entry
Saved report details Barrier Severity How To Overcome Barrier High return rates and support costs
Severity High
How To Overcome Invest in quality control, user-friendly app, and responsive support.
Barrier Brand recognition
Severity Medium
How To Overcome Leverage influencer marketing and reviews; offer warranties.
Barrier Tariffs and trade policy
Severity Medium
How To Overcome Diversify sourcing; consider dual-base manufacturing.
Commercial opportunities
| Opportunity | Why | How To Capture |
|---|---|---|
| Opportunity Camera-integrated feeders | Why Camera penetration jumped from 30% to 68% in two years; consumers value remote monitoring. | How To Capture Develop models with HD cameras, night vision, and two-way audio. |
| Opportunity AI-powered personalized feeding | Why AI can optimize portions based on pet activity and health data. | How To Capture Partner with pet health platforms; integrate activity trackers. |
| Opportunity Subscription and consumables | Why Recurring revenue from food, filters, and accessories. | How To Capture Offer auto-delivery of compatible food and parts. |
| Opportunity Multi-pet households | Why Dual-hopper and facial recognition enable feeding multiple pets. | How To Capture Launch multi-pet solutions with microchip or facial ID. |
Alternative markets
| Country | Why Consider | Compared To This |
|---|---|---|
| Country Canada | Why Consider Similar pet ownership trends, lower competition, easier certification (ISED instead of FCC). | Compared To This Easier |
| Country United Kingdom | Why Consider Large pet market, English language, but requires UKCA certification. | Compared To This Similar |
| Country Germany | Why Consider Largest European pet market, high spending, but CE certification and German language required. | Compared To This Harder |
| Country Australia | Why Consider Growing pet tech market, but strict biosecurity and RCM certification. | Compared To This Harder |
04Costs & commercial scenarios
Costs & commercial scenarios
Illustrative landed costs, pricing and break-even assumptions.
Pricing evidence
Illustrative assumptions only. Obtain written quotes and verify duties, costs and demand before investing.
- Retail Price Range
USD 50 - USD 350
- Wholesale Expectation
USD 30 - USD 150
- Landed Cost Target
USD 25 - USD 100
- Margin Pressure
Medium
- Price Anchors
Saved report details Tier Range Note Tier Entry-level
Range USD 50-100
Note Basic Wi-Fi/app control, no camera; higher return rates.
Tier Mid-range
Range USD 100-200
Note Camera, portion control, Alexa compatibility; sweet spot for volume.
Tier Premium
Range USD 200-350
Note AI features, dual-hopper, advanced monitoring; higher margins.
- Notes
Premium smart feeders with cameras and app control retail between USD 150 and USD 350 (Fairfield Market Research). Price sensitivity is medium; consumers willing to pay for reliability and features.
Illustrative cost assumptions
Illustrative assumptions only. Obtain written quotes and verify duties, costs and demand before investing.
- Currency
USD
- Reference Unit
one Wi-Fi/app-controlled smart pet feeder (3–5L capacity, no camera)
- Lines
Saved report details Item Best Base Worst Note Item FOB price (China)
Best 25
Base 32
Worst 40
Note Estimate based on typical OEM pricing for mid-range smart feeders; not sourced.
Item Ocean freight (LCL, per unit)
Best 3
Base 5
Worst 8
Note Assumes 0.05 CBM per unit and LCL rate; 40ft container USD 1,800–4,500 (source [13]).
Item Insurance (0.5% of FOB)
Best 0.13
Base 0.16
Worst 0.20
Note Typical marine insurance rate.
Item U.S. import duty (4.2%)
Best 1.05
Base 1.34
Worst 1.68
Note HTS 8509.80.5095, 4.2% ad valorem (CBP ruling N257597, grade A).
Item Customs clearance & fees
Best 0.50
Base 1.00
Worst 1.50
Note Broker fees, ISF, etc., allocated per unit.
Item Port to warehouse inland freight
Best 1.00
Base 1.50
Worst 2.00
Note Estimate for LTL/parcel from port to 3PL.
Item 3PL receiving & storage (per unit)
Best 0.50
Base 1.00
Worst 1.50
Note Estimate.
Item Certification amortization (FCC, UL/ETL)
Best 0.50
Base 1.00
Worst 2.00
Note Estimate: FCC ~USD 2,000–5,000; UL/ETL ~USD 10,000–20,000; amortized over 5,000–10,000 units.
Item Warranty/returns reserve (5%)
Best 1.50
Base 2.00
Worst 3.00
Note Estimate based on 12–20% of gross profit consumed by returns (source [11]).
- True Landed Cost Base
45.00
- Distributor Sale Price
70.00
- Retail Price
150.00
- Distributor Margin
35–40%
- Importer Gross Margin
55%
- Contribution Per Unit
80.00
- Assumptions
FOB price is an estimate; actual quotes required.
Freight rates based on 2025 ranges from source [13]; LCL assumed.
Duty rate from CBP ruling N257597 (grade A).
Certification costs are estimates; no sourced data.
Returns reserve is an estimate based on industry commentary (source [11]).
Retail price range USD 120–180 based on market reports (sources [5], [11]).
Break-even: not a profit guarantee
Illustrative assumptions only. Obtain written quotes and verify duties, costs and demand before investing.
- Setup Costs
Saved report details Item Amount Item Product certification (FCC, UL/ETL)
Amount USD 15,000
Item Initial inventory (1,000 units at USD 45 landed)
Amount USD 45,000
Item Amazon/Shopify setup & marketing
Amount USD 10,000
Item Legal & compliance (labeling, terms)
Amount USD 3,000
- Total Setup Cost
USD 73,000
- Contribution Per Unit
USD 80
- Break Even Units
913
- Conservative Monthly Sales
300
- Estimated Break Even Months
3.0
- Assumptions
Contribution per unit = retail price USD 150 minus landed cost USD 45 minus variable selling costs (Amazon fees ~15% = USD 22.50) = USD 82.50; rounded to USD 80.
Setup costs include certification and initial inventory; marketing and legal are estimates.
Monthly sales of 300 units is conservative for a new brand in this category.
Break-even calculated as total setup cost divided by contribution per unit, then divided by monthly sales.
05Product, compliance & risks
Product, compliance & risks
Suggested specifications, import checks and supplier questions.
Regulations to verify
| Requirement | Mandatory | Authority | Detail |
|---|---|---|---|
| Requirement FCC Part 15 certification for Wi-Fi devices | Mandatory Mandatory | Authority Federal Communications Commission (FCC) | Detail All intentional radiators (Wi-Fi, Bluetooth) must be certified to ensure they don't cause interference. |
| Requirement UL or ETL safety certification | Mandatory Recommended | Authority Underwriters Laboratories (UL) or Intertek (ETL) | Detail Not federally mandated but required by major retailers; ensures electrical safety. |
| Requirement FCC labeling and user manual disclosures | Mandatory Mandatory | Authority FCC | Detail Devices must display FCC ID and include compliance statements. |
| Requirement California Proposition 65 warning | Mandatory Mandatory | Authority California Office of Environmental Health Hazard Assessment | Detail If product contains chemicals known to cause cancer or reproductive harm, warning required. |
Import and logistics
- Estimated Tariff
4.2% ad valorem under HTS 8509.80.5095, plus potential additional tariffs (e.g., Section 301) depending on origin.
- Hs Code Suggestion
8509.80.5095
- Trade Agreements
None applicable for China; USMCA for Mexico/Canada if sourced there.
- Typical Lead Time
Sea freight from China to U.S. West Coast: 14-21 days; East Coast: 25-35 days. Total lead time including production: 45-60 days.
- Shipping Notes
FCL 40ft container costs USD 1,800-4,500 from China to USA; rates higher during peak seasons. West Coast ports faster and cheaper.
- Top Source Countries
China
Vietnam
Mexico
Suggested requirements — not verified model specifications
- Headline
Source a Wi-Fi/app-controlled feeder with 3–5L capacity, backup battery, and FCC/UL certification.
- Specs
Saved report details Attribute Requirement Why Attribute Capacity
Requirement 3–5L
Why Dominant U.S. segment (source [3]).
Attribute Connectivity
Requirement Wi-Fi 2.4GHz with app control
Why Wi-Fi segment largest in U.S. (source [3]).
Attribute Power backup
Requirement Battery backup (D-cell or rechargeable)
Why Prevents disruption during outages; key buyer concern (source [11]).
Attribute Portion control
Requirement 1–10 portions per meal, 5–15g per portion
Why Health and portion control are top drivers (source [3]).
Attribute Certification
Requirement FCC Part 15, UL/ETL (or equivalent)
Why Required for legal sale and retailer acceptance.
Attribute App
Requirement iOS/Android app with scheduling and notifications
Why Core smart feature; must be stable and user-friendly.
Attribute Material
Requirement BPA-free plastic, sealed hopper
Why Food safety and freshness.
Attribute Warranty
Requirement 1-year limited warranty
Why Standard for consumer electronics; builds trust.
Attribute Packaging
Requirement Retail-ready, English labeling
Why Required for U.S. retail and e-commerce.
- Target Fob
USD 25–35
- Target Moq
500–1,000 units
- Deal Breakers
No FCC certification or test reports
No UL/ETL certification (or unwilling to obtain)
App requires Chinese phone number or has poor English support
No battery backup
Capacity below 3L
Questions for the supplier
| Question | Why It Matters | Good Answer |
|---|---|---|
| Question Can you provide FCC test reports and certificate for this model? | Why It Matters FCC is legally required for Wi-Fi devices in the U.S. | Good Answer Yes, with report from accredited lab and FCC ID. |
| Question Do you have UL or ETL certification for the power adapter and device? | Why It Matters Major retailers and Amazon may require it; reduces liability. | Good Answer Yes, UL/ETL certificate available. |
| Question What is the app development platform and who maintains it? | Why It Matters App stability is critical for reviews and returns. | Good Answer In-house team or reputable third-party with regular updates. |
| Question What is the warranty policy and defect rate? | Why It Matters Affects returns and support costs. | Good Answer 1-year warranty, <2% defect rate. |
| Question Can you customize packaging and labeling for U.S. market? | Why It Matters Retail readiness and compliance. | Good Answer Yes, with English manual and retail box. |
| Question What is the MOQ and lead time for first order? | Why It Matters Cash flow and speed to market. | Good Answer MOQ 500–1,000, lead time 30–45 days. |
| Question Do you offer battery backup and what type? | Why It Matters Key feature for U.S. buyers. | Good Answer Yes, D-cell or rechargeable backup. |
| Question Can you provide references from U.S. customers? | Why It Matters Validates export experience and compliance. | Good Answer Yes, with contactable references. |
| Question What is the price for 1,000 units FOB? | Why It Matters Cost basis for landed cost model. | Good Answer USD 25–35 depending on specs. |
Risks and mitigations
| Risk | Severity | Mitigation |
|---|---|---|
| Risk High return rates due to connectivity and setup issues | Severity High | Mitigation Invest in rigorous testing, user-friendly app, and responsive customer support. |
| Risk Tariff and trade policy changes | Severity Medium | Mitigation Diversify sourcing across countries; monitor trade negotiations. |
| Risk Intense competition and price pressure | Severity Medium | Mitigation Differentiate through features, quality, and brand; avoid pure price competition. |
| Risk Technological obsolescence | Severity Low | Mitigation Continuous innovation and firmware updates; modular design for upgrades. |
06Your next steps
Your next steps
Entry approach, validation checklist and proposed actions.
Proposed entry approach
- Recommended Approach
Source from a reliable Chinese OEM with FCC and UL certifications, focus on mid-range Wi-Fi feeders with cameras, and launch via Amazon and DTC with strong support.
- First Steps
Identify and audit 2-3 suppliers with FCC/UL certifications.
Develop a mid-range model with reliable Wi-Fi and camera.
Set up Amazon seller account and DTC website.
Plan initial inventory order and logistics.
- Timeline
6-9 months from sourcing to launch.
- Estimated Investment
USD 50,000 - USD 150,000 for initial inventory, certifications, and marketing.
Illustrative validation plan — not a promised timeline
- Phase1
Research and sourcing
- Window
0-30 days
- Steps
Identify 3–5 candidate suppliers from Alibaba/Global Sources
Request samples and certification documents
Get quotes for FCC/UL testing
Analyze top Amazon competitors
- Phase2
Certification and order
- Window
31-60 days
- Steps
Select supplier and place sample order
Initiate FCC/UL certification
Set up Amazon Seller Central and Shopify
Finalize packaging and labeling
- Phase3
Launch and test
- Window
61-90 days
- Steps
Receive first inventory (500–1,000 units)
Launch on Amazon with PPC campaign
Monitor returns and reviews
Adjust pricing and marketing
- Go No Go Trigger
Achieve at least 100 units sold in first month with return rate below 10% and positive reviews (4+ stars).
Validation checklist
| Unknown | How To Validate | Why It Matters |
|---|---|---|
| Unknown Actual demand and return rates for specific product | How To Validate Run a small Amazon test (500 units) and monitor return reasons. | Why It Matters Returns can erode margins significantly. |
| Unknown Certification costs and timelines | How To Validate Get quotes from FCC/UL testing labs. | Why It Matters Affects total investment and time to market. |
| Unknown Supplier reliability and quality | How To Validate Order samples, conduct factory audit, check references. | Why It Matters Quality issues lead to returns and brand damage. |
| Unknown Competitive pricing and feature gaps | How To Validate Analyze top 20 Amazon listings for price, features, reviews. | Why It Matters Helps position product and set price. |
| Unknown Tariff and trade policy changes | How To Validate Monitor CBP and USTR announcements; consider dual sourcing. | Why It Matters Tariffs can change landed cost dramatically. |
Actions and responsibilities
| Action | Priority | Owner |
|---|---|---|
| Action Verify supplier certifications (FCC, UL) and request test reports. | Priority Do now | Owner Sourcing/Procurement |
| Action Conduct competitive analysis of top-selling Amazon models. | Priority This week | Owner Market Research |
| Action Develop app and connectivity testing protocol. | Priority This month | Owner Product Development |
| Action Secure initial inventory financing and logistics partners. | Priority This month | Owner Finance/Operations |
Trade-show preparation
| Tip | Why |
|---|---|
| Tip Attend Global Pet Expo (Orlando, March) and SuperZoo (Las Vegas, August). | Why Major U.S. pet industry trade shows for networking and product showcasing. |
| Tip Prepare demo units with live Wi-Fi connectivity. | Why Hands-on experience builds buyer confidence and showcases reliability. |
| Tip Highlight certifications (FCC, UL) prominently. | Why Retailers and distributors prioritize compliance. |
07Evidence & sources
Evidence & sources
Research confidence, open questions, references and limitations.
Evidence quality and limitations
- Overall Grade
C
- Note
Market size data from multiple research firms but conflicting; tariff ruling is grade A; certification and cost data are missing.
- Claims
Saved report details Claim Grade Basis Claim U.S. smart pet feeder market was USD 601.38M in 2024, growing at 8.08% CAGR to 2030
Grade C
Basis Grand View Research and Research and Markets reports (sources [2], [3])
Claim HTS 8509.80.5095 applies with 4.2% duty
Grade A
Basis CBP ruling N257597 (source [9])
Claim Returns and support can consume 12–20% of gross profit
Grade C
Basis Market.us report (source [11])
Claim Wi-Fi segment is largest in U.S.
Grade C
Basis Grand View Research (source [3])
Claim FCC certification is required for Wi-Fi devices
Grade A
Basis FCC regulations (general knowledge, not in evidence)
Claim UL/ETL certification is often required by retailers
Grade D
Basis Industry practice, not sourced
Claim Ocean freight from China to U.S. costs USD 1,800–4,500 per 40ft container
Grade D
Basis Freight forwarder blog (source [13])
Known findings and open gaps
- Known
U.S. market size and growth (grade C)
Tariff classification and duty rate (grade A)
Wi-Fi segment dominance (grade C)
Returns/support burden (grade C)
- Likely
FCC certification required for Wi-Fi
UL/ETL preferred by retailers
Amazon is a key channel
China is primary sourcing country
- Unknown
Actual certification costs and timelines
Specific competitor market shares
U.S. import volumes for smart pet feeders
Distributor margins and terms
- Needs Verification
Supplier certifications and test reports
Product quality and defect rates
App stability and user reviews
Tariff exclusions or changes
Sources
Scenario assumptions
Illustrative assumptions only. Obtain supplier, logistics and compliance quotations before committing money. Figures are not guaranteed sales, costs or profit.
Research limitations
Automatically published AI research. Figures and findings are supplied as assumptions and may be incomplete, inconsistent or inaccurate. Publication is not human review or independent verification. Check source dates and unresolved gaps. The stated margin may use a different basis from the supplied cost and sale-price figures. Returned values are estimates, not validated calculations. All modelled costs, prices, tariffs, volumes and break-even figures are assumptions, not quotations or verified outcomes. Product requirements and specifications are provider-supplied claims or suggestions, not independently verified model specifications.
Important limitations
This report is based on publicly available information and estimates. Figures are subject to change and should be verified independently. The author is not liable for any business decisions made based on this information.
https://www.chinaconnect247.com/ur/market-research/smart-pet-feeders-wi-fi-app-controlled-united-states